

A grand comparison!
Features
- A year displayed at a glance
- Clear understanding of the numbers
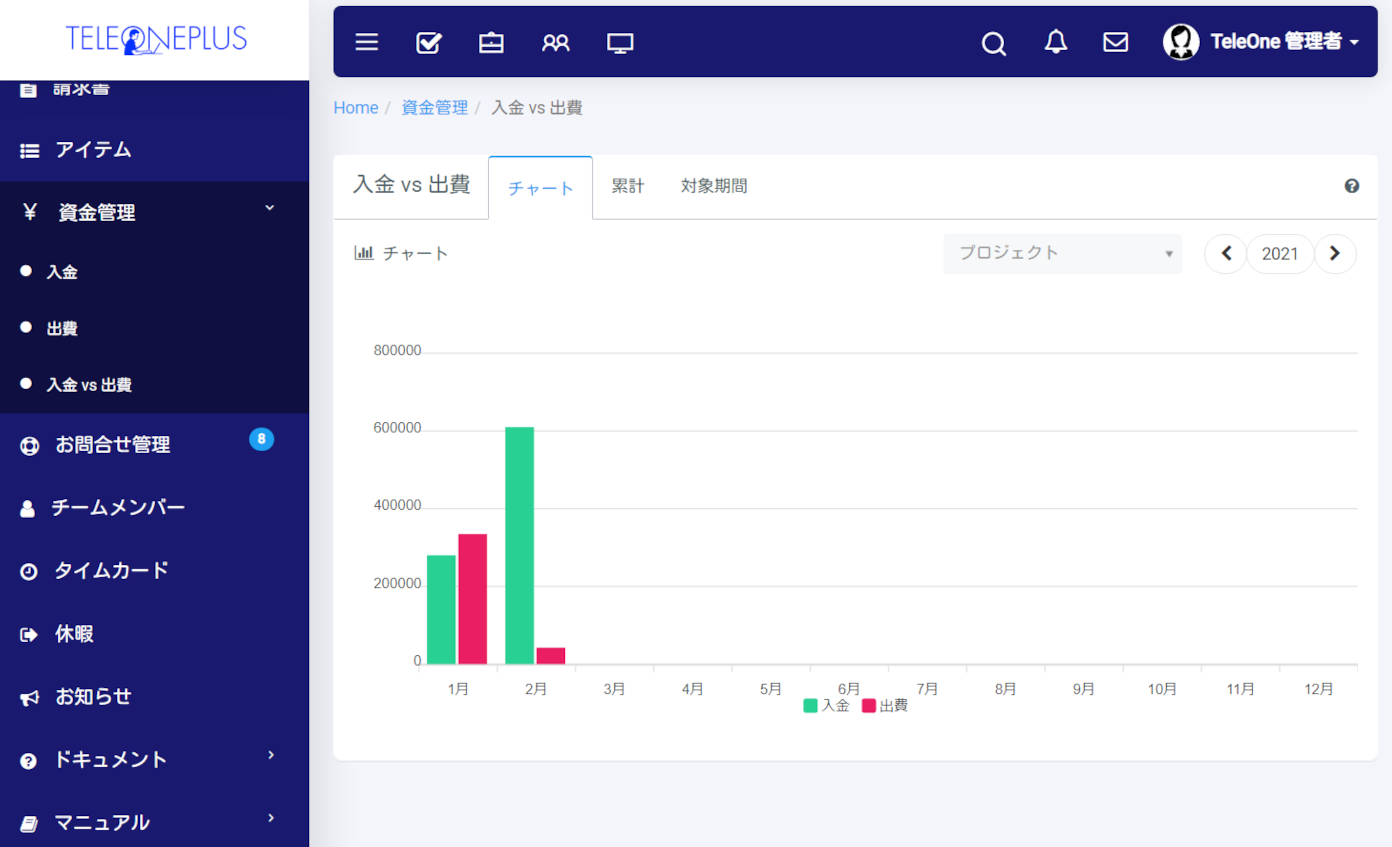
Income vs. Expense Chart:
Streamline Your Workflow with TELEONEPLUS!
Streamline Your Workflow with TELEONEPLUS!
Income vs. Expense Chart:
Streamline Your Workflow with TELEONEPLUS!
Streamline Your Workflow with TELEONEPLUS!
Point 01
A year displayed at a glance
As team members input income and expenses, the chart is continuously updated.
Anyone can visually grasp the revenue at any time.
You can switch the displayed years and view charts for specific projects.
Point 02
Clear understanding of the numbers
In the “Chart,” you can see the detailed information in the “Cumulative” section. It provides a clear display of monthly income, expenses, and profits.
There are switching and filtering functions, allowing you to directly view the desired information.
It’s a collaboration system that prioritizes visualization.